Read charts without inventing certainty
Use candles, trends and levels as descriptions of market history, then separate those observations from predictions.
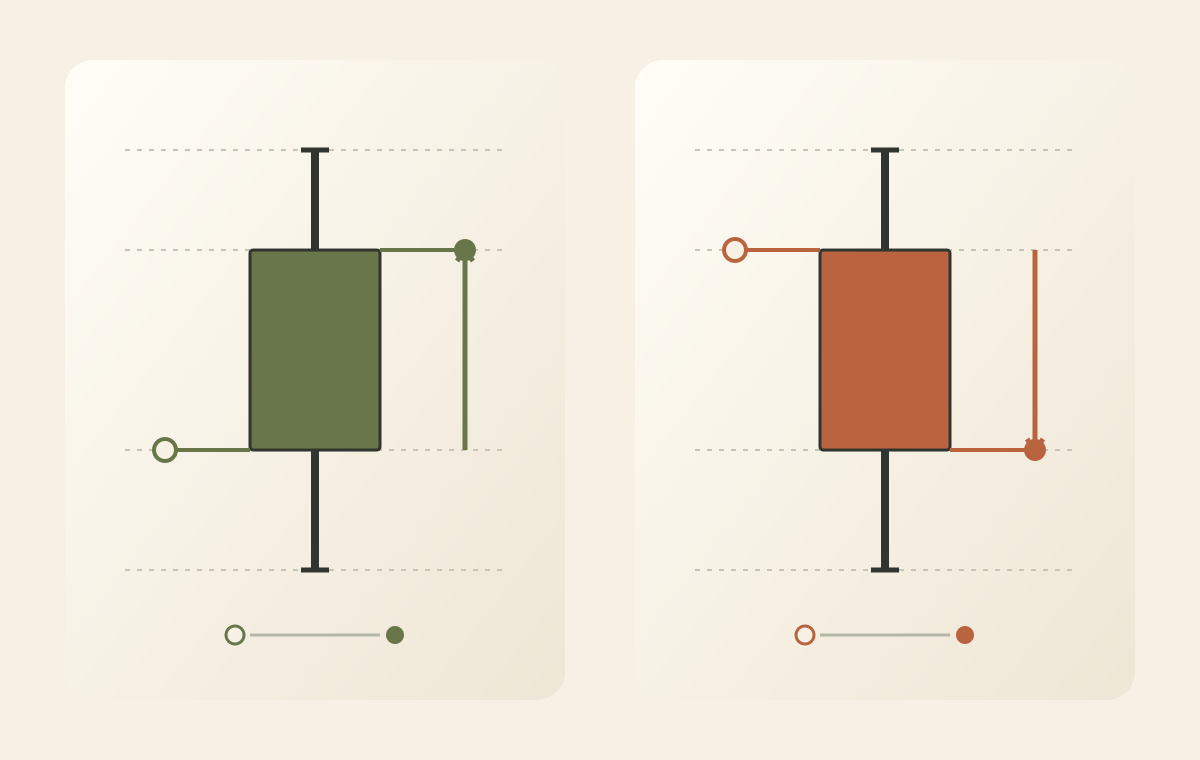
Know what each mark represents
A price chart compresses transactions into a visual record. A candle usually shows an opening price, a high, a low and a closing price for one interval. Its body spans the open and close, while its wicks mark the extremes. A one-hour candle and a one-day candle describe different aggregations of the same market; neither is inherently the true view.
Before interpreting a shape, check the instrument, venue, quote currency, time zone and adjustment method. A stock split can create an apparent discontinuity on an unadjusted chart. A crypto price from one venue may differ from another. A continuous futures series may stitch together different contracts. These construction choices can change the story a chart appears to tell.
A candle also discards the order in which prices occurred. A bar with open $50, high $55, low $45 and close $52 could have visited its high before its low or its low before its high. The same four numbers fit both paths. If a strategy’s stop and target sit inside that range, the candle alone cannot identify which would have been reached first. A small body can also coexist with long wicks: little open-to-close change does not mean the interval was quiet.
Describe a trend precisely
A sequence of higher swing highs and higher swing lows is often called an uptrend. That description depends on how swings are identified and on the selected timeframe. A weekly rise can contain a daily decline and an hourly rebound. Stating the timeframe avoids the unhelpful argument that a market is simply bullish or bearish in every possible sense.
A moving average smooths a chosen set of past prices. A twenty-observation simple average is their sum divided by twenty. It reacts after new prices arrive, not before. A price crossing the average is an observable event; whether that event predicts useful future returns is a separate empirical question that must include costs and failures.
Treat support and resistance as hypotheses
Technical analysts often mark areas around previous lows as support and previous highs as resistance. These are historical reference zones, not physical barriers. Traders may watch them, but new information, changing participation or thin liquidity can carry price straight through. A line drawn neatly after the event can conceal how ambiguous the decision looked in real time.
Write an operational definition before inspecting the outcome. For example, a paper exercise might define a breakout as a close above the highest closing price of the preceding twenty sessions. That definition can be tested. Saying the chart looked strong cannot be tested consistently, because the meaning can change after success or failure.
Use a chart to ask better questions
Volume, volatility and price can describe different aspects of activity. A long candle says the interval covered a wide price range; it does not reveal every participant’s intention. High volume means more units changed hands under that dataset’s definition, not that everyone agreed about value. Each completed transaction has a buyer and seller with potentially different reasons for acting.
A productive chart annotation separates observation, hypothesis and invalidation. Observation: the close exceeded a prior range. Hypothesis: that condition may be associated with continued movement. Invalidation: the predefined rule is no longer met or the evidence fails a test. Keeping these sentences separate makes it harder to confuse an attractive picture with a demonstrated advantage.
For a simple practice task, hide the right-hand side of a historical chart and annotate only what is visible. Save the annotation before revealing subsequent prices. Then compare the original description with your reaction after the outcome becomes known. This does not prove predictive power, but it makes hindsight visible and encourages consistent language rather than increasingly elaborate explanations for every move.
Translate a visual claim into a reproducible observation
Take the proposed twenty-session breakout. Specify whether the comparison uses earlier closes or earlier highs, whether today is excluded from the reference window, and when the current close becomes final. “Today’s close exceeds the highest close of the previous twenty completed sessions” is a different rule from “today traded above the previous twenty-session high at any point.” One can trigger while the other does not. Neither definition establishes an edge, but either can be applied consistently.
Next define the outcome being measured. A five-session forward return, the next session’s opening gap and the largest adverse move before exit answer different questions. Comparing a chart pattern with whichever future horizon looks best is another form of searching through results. Record the horizon and execution convention before revealing the later chart, then keep failures as well as successes. A pattern library consisting only of memorable winners has no meaningful denominator.
Data boundaries can alter the appearance of the signal. A daily candle may be built from regular trading hours or include extended trading, and different time zones can divide a continuously traded market into different daily bars. A missing observation is not necessarily a zero return. An unchanged displayed price may be a stale quote rather than evidence of calm trading. Check these definitions before comparing a chart from one provider with a backtest built from another.
Indicators do not create independent evidence merely by being displayed in different panels. Two moving averages and a momentum oscillator may all reuse much of the same recent price history. Agreement between them can therefore be less informative than three genuinely different observations. Ask what additional information each calculation contributes, and whether the proposed advantage remains after costs and a fair comparison with simpler rules. The chart is a way to formulate a question; the test is what evaluates the answer.